HF Activity Group
SolarWx CDX ExplainerGauges? Dials? — I’m no scientist, just a ham!
Interplanetary Magnetic Fields (IMF) and HF Radio Propagation
Overview
This page provides information on Interplanetary Magnetic Fields (IMF) and their impact on High Frequency (HF) radio propagation. Understanding these factors is crucial for predicting and analyzing HF communication conditions.
IMF – Interplanetary Magnetic Fields
The IMF is typically described using three components: Bx, By, and Bz. These components are measured in nanoteslas (nT) and represent the magnetic field’s orientation and strength in three-dimensional space.
Bx (nT): North-South Component
- Description: Measures the magnetic field along the Sun-Earth line.
- Positive Bx: Points towards the Sun.
- Negative Bx: Points away from the Sun.
- Effect on HF: Generally has less direct impact on HF communications compared to By and Bz.
By (nT): East-West Component
- Description: Measures the magnetic field perpendicular to the Sun-Earth line in the ecliptic plane.
- Positive By: Points towards dusk (westward).
- Negative By: Points towards dawn (eastward).
- Effect on HF: Can influence the direction of geomagnetic disturbances and affect HF propagation paths, especially at high latitudes.
Bz (nT): Vertical Component
- Description: Measures the magnetic field perpendicular to the ecliptic plane.
- Positive Bz: Points northward, parallel to Earth’s magnetic field.
- Negative Bz: Points southward, opposite to Earth’s magnetic field.
- Effect on HF: Most critical for HF communications.
- Negative Bz: Can lead to geomagnetic storms, aurora, and significant disruptions in HF propagation.
- Positive Bz: Generally associated with calmer geomagnetic conditions and better HF propagation.
Gauges and HF Communications
- Bx Gauge:
- Range: Typically -10 nT to +10 nT.
- Interpretation: Extreme values may indicate solar wind disturbances but have less direct impact on HF.
- By Gauge:
- Range: Typically -10 nT to +10 nT.
- Interpretation: Large absolute values can affect high-latitude HF paths.
- Bz Gauge:
- Range: Typically -10 nT to +10 nT.
- Interpretation:
- Values below -5 nT: Increased risk of geomagnetic disturbances and HF disruptions.
- Values above +5 nT: Generally favorable for HF communications.
What’s this HF Score about? Exclusive to HFQSO.com
An Example: Let’s say the overall HF Score: 83 (Good conditions with some impacts)
Note: The following values are examples only and do not represent real-time data. Always refer to current space weather reports from HFQSO.com for up-to-date information and scores.
| Component | Example Value | Interpretation |
|---|---|---|
| Bx | -4.24 nT | Relatively calm, pointing slightly away from the Sun |
| By | 5.74 nT | Dawn-ward magnetic field orientation, may affect high-latitude paths |
| Bz | -1.16 nT | Mildly southward, potential for minor geomagnetic disturbances |
| X-ray Flare Class | C4.1 | Moderate X-ray activity |
| K-index | 3 | Minor geomagnetic activity |
| A-index | 15 | Unsettled geomagnetic conditions |
| Solar Flux Index (SFI) | 120 | Moderate solar activity |
| Sunspot Number (SSN) | 50 | Moderate sunspot activity |
| Overall HF Score | 83 | Good conditions with some impacts |
Analysis of Example Scenario
- The HF Score of 83 suggests generally good propagation conditions for the 17m, 15m, 12m, and 10m bands, with some potential impacts.
- Given that the Cdx can change rapidly, conditions may fluctuate quickly, especially on these higher frequency bands.
- A fast-moving Cdx would indicate constant change in conditions.
- Negative Bz values can reduce the HF score due to increased geomagnetic activity.
- C-class X-ray flare activity can impact the HF score.
- Moderate X-ray activity might cause possible minor disruptions to HF propagation.
- The K-index and A-index values indicate minor to unsettled geomagnetic conditions, which could affect HF propagation.
- Moderate SFI and SSN values suggest reasonable ionospheric conditions for HF propagation.
General Implications for HF Radio Users
- Regularly check current HF Scores on HFQSO.com, ideally every 5-10 minutes during active operating periods, to stay informed about rapidly changing conditions.
- Pay particular attention to the score when operating on the 17m, 15m, 12m, and 10m bands, as the HF Score is specifically tailored to these frequencies.
- Be prepared for quick changes in propagation conditions, especially during periods of high solar activity or geomagnetic disturbances.
- Use the frequently updated HF Score as a real-time guide for adjusting your operating strategy on the affected bands.
- Monitor for potential disruptions due to solar flares and geomagnetic activity.
- Pay attention to Bz values; negative values can lead to more challenging HF conditions.
- Consider the effects of By on high-latitude HF paths.
- Use the HF Score as a quick reference for overall conditions, but also consider individual parameters for a more detailed understanding.
Check HFQSO.com for the most up-to-date HF Score, as HF conditions can change rapidly.

The HF Score - Exclusive
The HF Score is an exclusive feature developed by HFQSO.com. It provides a comprehensive measure of HF propagation conditions by incorporating multiple space weather parameters.
 Calculation and Updates
- The HF Score is calculated using a special algorithm developed by HFQSO.com and specifically represents HF conditions for the 17m, 15m, 12m, and 10m bands.
- The score is updated every 5 minutes to provide near-real-time information.
- HF (Cdx) can change rapidly, reflecting the dynamic nature of ionospheric conditions.
Some components of the HF Score
The HF Score takes into account:
- IMF Components (Bx, By, Bz)
- Solar Indices:
- K-index: Measure of geomagnetic activity
- A-index: Daily average of K-indices
- Solar Flux Index (SFI): Measure of solar radio emissions
- Sunspot Number (SSN): Count of sunspots on the solar surface
- more …… because we have secrets!
Interpretation
- The HF Score provides a single value that represents overall HF propagation conditions for the specified bands (17m, 15m, 12m, and 10m).
- Higher scores generally indicate more favorable conditions for HF communications on these bands.
- Due to the frequent updates and rapidly changing Cdx, users should check the score regularly for the most accurate assessment of current conditions.

K-Index, A-Index, Solar Flux, and Solar Wind Speed
The K index (0-9) measures short-term geomagnetic activity, updated every 3 hours. The A index (0-100) is a daily average derived from the K index. Lower values for both indicate better HF propagation. The Solar Flux Index (SFI), typically 50-300, measures solar radio emissions at 2800 MHz; higher values suggest improved propagation on higher HF bands.
Solar wind, a stream of charged particles from the Sun’s corona, interacts with Earth’s magnetosphere. Its speed (300-800 km/s) and intensity affect geomagnetic conditions. Increased activity can disrupt HF propagation but may enhance VHF auroral propagation. Ham operators use these indices to anticipate and adapt to changing ionospheric conditions.

NOAA Space Wx Scales - Radio Blackouts, Solar Radiation & Geomagnetic Storms
The NOAA space weather scales R, S, and G describe the severity of radio blackouts, solar radiation storms, and geomagnetic storms respectively. Each scale ranges from 1 (minor) to 5 (extreme). The R scale measures radio blackouts caused by solar flares, with higher levels indicating more severe HF disruptions. The S scale quantifies solar radiation storms, which can affect satellite communications and polar routes.
The G scale measures geomagnetic storms resulting from coronal mass ejections (CMEs). Higher G levels can cause auroras at lower latitudes and impact HF propagation. G1 (minor) may enhance HF conditions, while G3 and above typically disrupt HF communications. Ham operators use these scales to anticipate potential impacts on radio propagation and adjust their operating strategies accordingly.

NOAA GOES X-RAY FLUX Table
Solar X-ray flares are intense bursts of radiation from the Sun, classified as A, B, C, M, and X, with X being the strongest. Each class is 10 times more powerful than the previous. For example, an M1 flare is 10 times stronger than a C1, and an X1 is 10 times stronger than an M1. Numbers after the letter indicate strength within that class (e.g., M5, X2).
Flares affect HF radio by increasing ionization in the Earth’s lower ionosphere. C-class flares have little effect on HF. M-class flares can cause brief radio blackouts, mainly on lower HF bands. X-class flares can create widespread, longer-lasting HF blackouts, especially on the sunlit side of Earth. Ham operators may experience sudden signal loss or weakening during these events, with stronger flares causing more severe and widespread disruptions.

Space Weather Prediction Center (SWPC) Forecast
This is a Space Weather Forecast Discussion issued by the Space Weather Prediction Center (SWPC), which is part of NOAA. These forecasts provide critical information about solar and geomagnetic conditions that can affect various technologies, including radio communications.
The discussion typically includes recent solar activity, such as flares and their intensities, active regions on the Sun, and any significant space weather events. It’s designed to help users, including ham radio operators, satellite operators, and others affected by space weather, to understand current conditions and prepare for potential impacts. The information is technical but crucial for anticipating changes in radio propagation and other space weather-related effects.
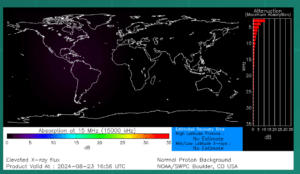
DRAP for 15Mhz
DRAP (D-Region Absorption Prediction) is a model that estimates HF radio signal absorption caused by solar flare activity. It calculates expected signal loss on HF paths due to increased D-layer ionization from X-ray flares. Higher DRAP values indicate greater absorption, potentially leading to communication difficulties.
The model considers factors like flare intensity, signal path, and day/night conditions. Ham operators use DRAP forecasts to anticipate potential HF propagation issues during solar events, helping them adjust their operating strategies accordingly. This tool is particularly useful for predicting short-term impacts on various HF bands during periods of increased solar activity.

Real-time AI Predictions for HF
Another exclusive feature developed by HFQSO.com is the live AI HF Prediction system. Utilizing AI technologies to dynamically predict HF Cdx for the Activity Group bands each day.
This is a real-time AI-generated prediction for High Frequency (HF) radio propagation conditions. It uses current solar and geomagnetic data to assess the likely impact on specific HF frequency bands used by ham radio operators and others.
The prediction considers several key factors: the Kp index (a measure of geomagnetic activity), A index (a daily average of geomagnetic activity), Solar Flux (a measure of solar radio emissions), Solar Wind speed, and recent X-ray flare activity. It then provides an analysis of how these conditions might affect radio signal propagation on specific HF frequencies. The assessment includes explanations of how each factor contributes to the overall prediction, helping users understand the current state of the ionosphere and its effect on radio communications. Only on HFQSO.com.

Solar Thematic Map
A solar thematic map image visually represents the Sun’s surface features. It shows the Sun’s disk with highlighted phenomena like sunspots (dark areas), flares (bright flashes), and coronal holes (darker regions). These features are often color-coded and numbered for easy identification.
The image typically includes a coordinate grid, date/time stamp, orientation markers, and a legend. This visual tool allows ham radio operators and space weather enthusiasts to quickly assess current solar conditions and their potential effects on radio propagation and other technologies.